
236 Sarcomas Profiled in One Sitting. Two Routes to One Broken Pathway
We ran a full multi-omic sarcoma analysis in a single session of Pan.bio Notebooks. Every step was a plain-English question to bioMind. The most interesting result was one we never asked for.

Rare cancers stay understudied, and the bottleneck usually isn't the biology. It's the tooling. A sarcoma cohort spread across mutations, copy number, and expression means three matrices, three schemas, and a pile of glue code before anyone asks a single scientific question.
We ran the whole thing start to finish in one sitting: A real cohort (TCGA-SARC, public), three omics layers, no pipeline to stand up, nothing pre-baked. Every step below was a natural-language prompt to bioMind inside a Notebook, bioMind wrote the code, we read it, ran it, and decided what came next.
Here is the argument of this post stated up front: The result we end on, that TP53 mutation and MDM2 amplification are mutually exclusive routes to disabling the same pathway, is established cancer biology.
We basically handed bioMind, our AI assistant, a pile of real tumor data and asked it questions in ordinary language. It rediscovered a rule of cancer biology that scientists already knew. That is how you find out whether you can trust it on data where nobody knows the answer yet.
Why sarcoma Is a Real Multi-Omic Test Case
Sarcomas are cancers of connective tissue: bone, muscle, fat, cartilage. They account for roughly 1% of adult cancers and span more than seventy histological subtypes. They are frequently complex-karyotype and sparse in recurrent point-mutation drivers, which makes any single omics layer a poor summary of the cohort. The signal lives in how the layers agree. That also makes sarcoma a genuinely useful stress test for multi-omic integration.
Ground rules for this run: TCGA-SARC as the source, mutations plus copy number plus expression, and a human executing and reviewing every cell. This analysis starts from called data, so it skips upstream pipelines entirely.
Step 1: Meet the cohort
Prompt: "Load the TCGA sarcoma data, mutations, copy number, and expression, and tell me how many tumors we have."
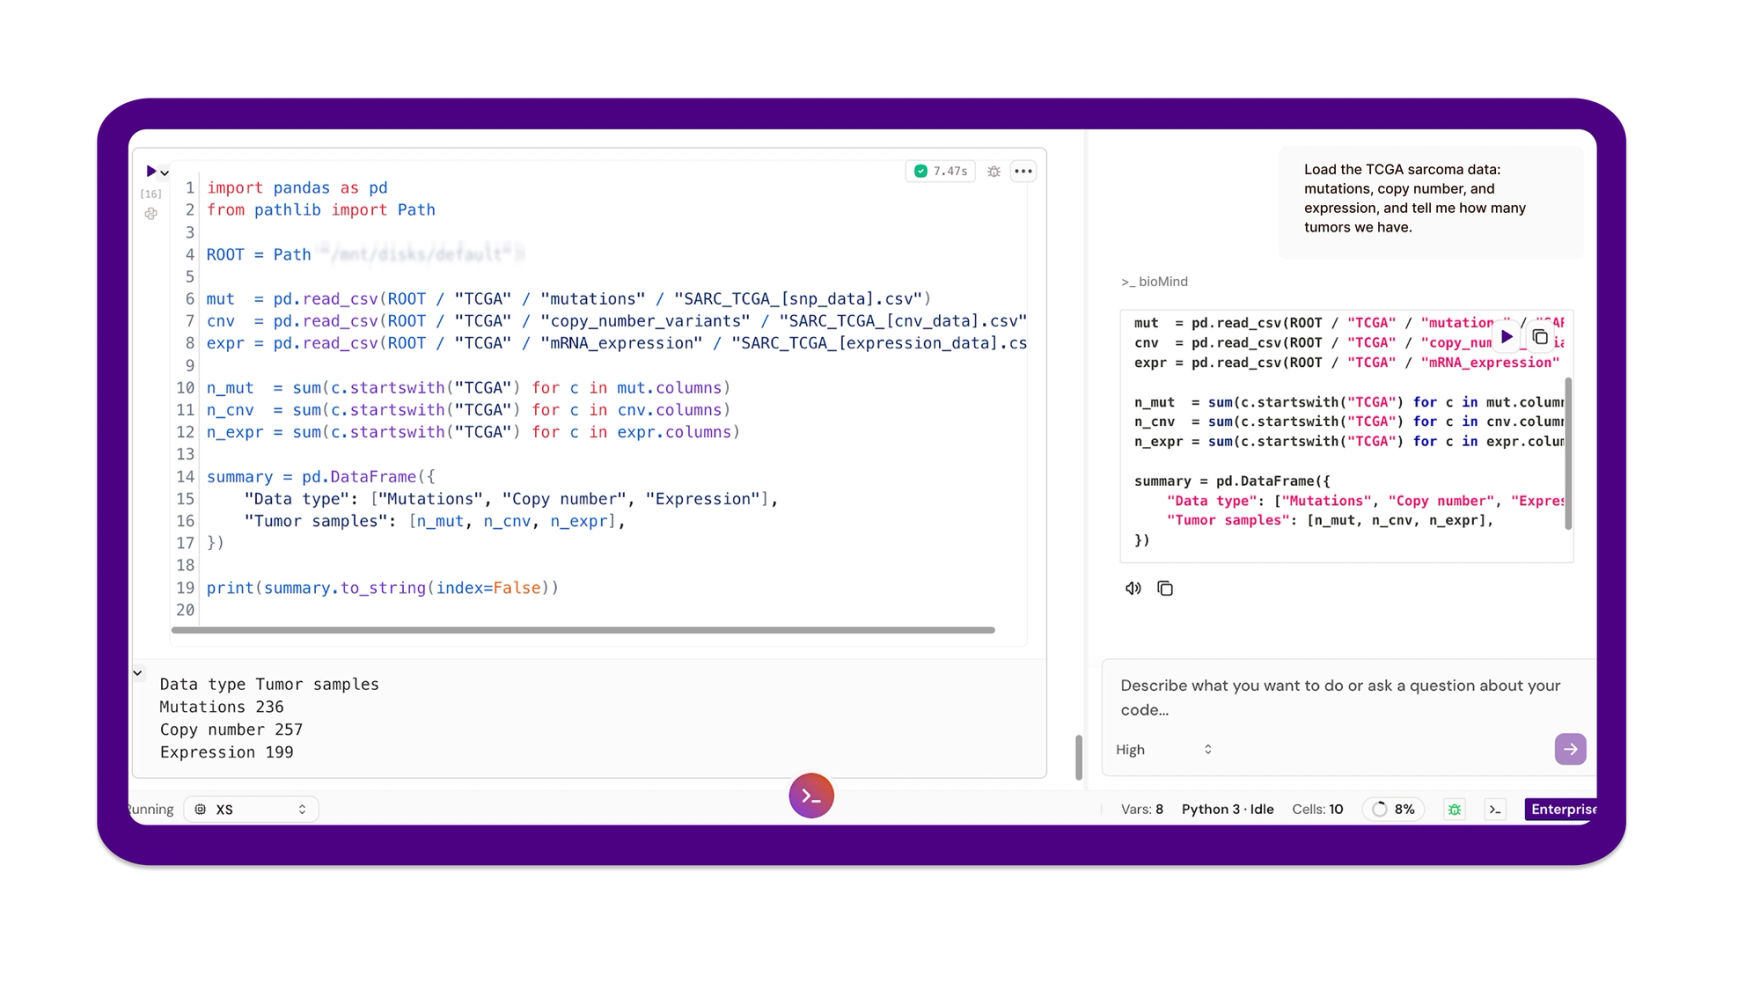
bioMind pulled the three matrices, reconciled sample identifiers across them, and reported the counts: 236 tumors with somatic mutation calls, 257 with copy-number profiles, 199 with mRNA expression. Two overlaps matter downstream: 234 tumors have both mutation and copy-number data, and 193 have both copy number and expression.
Attrition across layers is normal for TCGA-SARC, and the analyzable set for any given cross-omics test is whichever intersection that test requires. Pinning those numbers down before anything else prevents an entire analysis being quietly run on the wrong denominator.
Step 2: What is broken
Prompt: "Show the most frequently mutated genes in the sarcoma cohort, and highlight the known drivers."
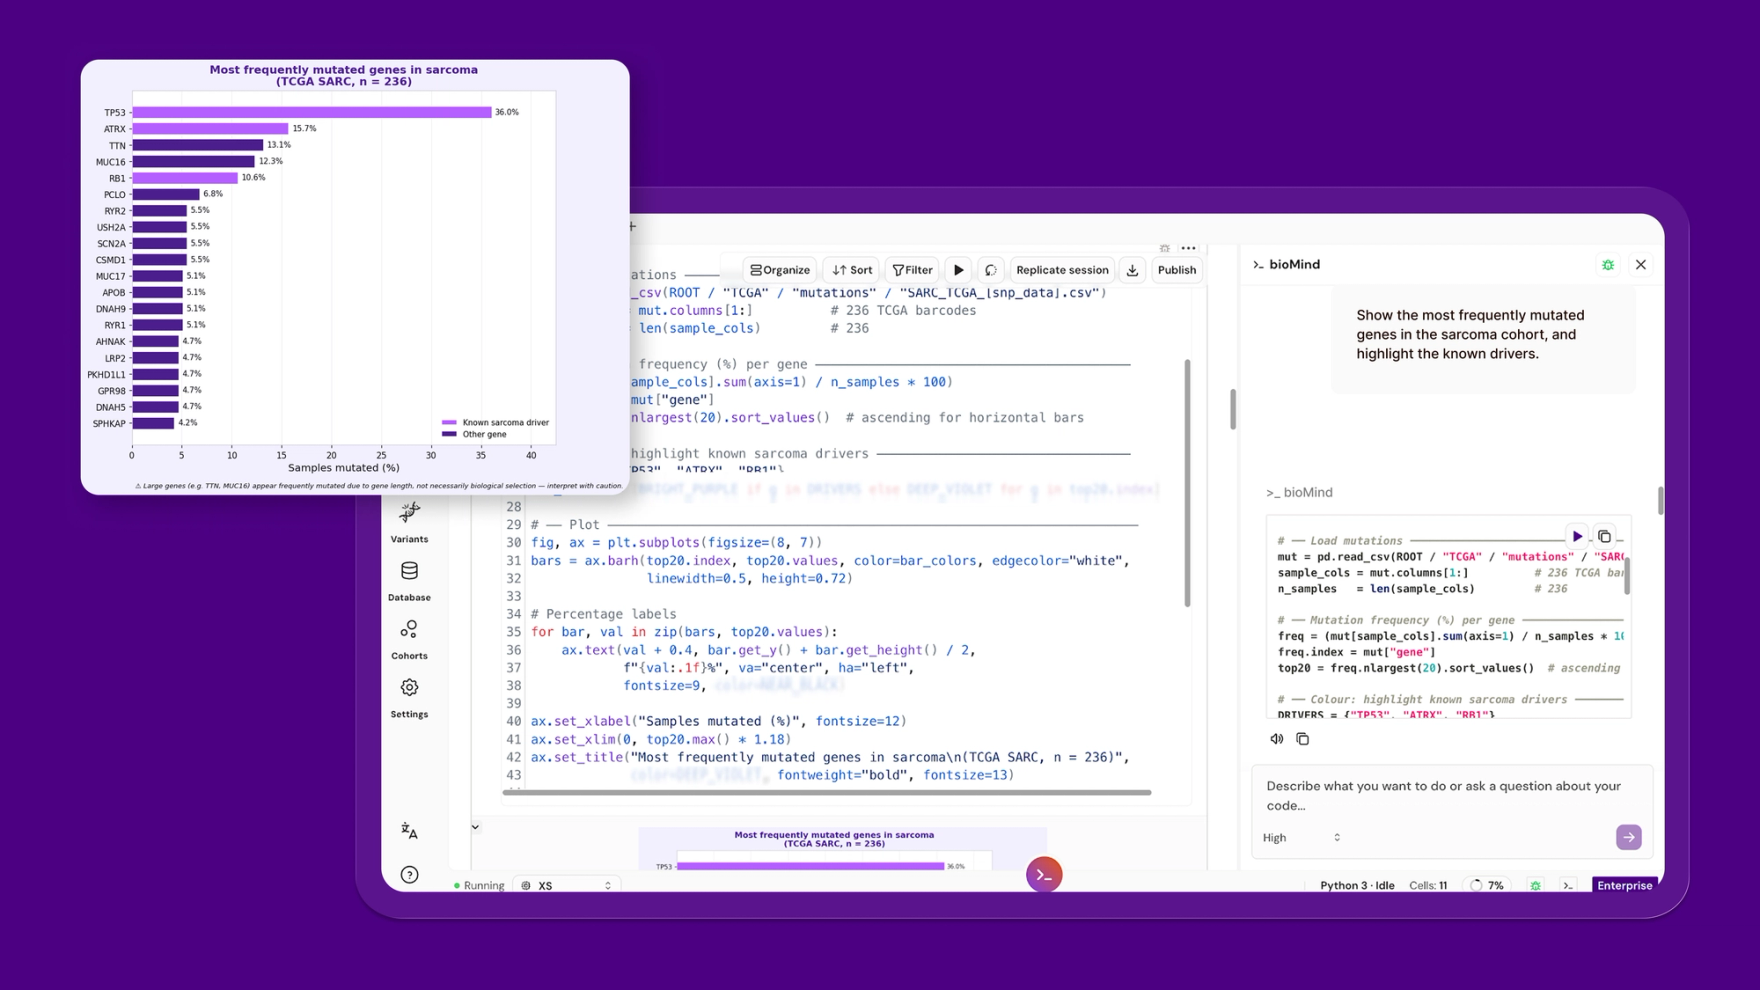
bioMind ranked genes by mutation frequency across the 236 tumors and flagged the known drivers. TP53 came out on top, mutated in 36%. After that the landscape thins fast: ATRX at 16% and RB1 at 11% are the next biologically credible recurrent drivers, ATRX tied to alternative lengthening of telomeres, RB1 to cell-cycle control. The rest of the top twenty sits near 5%.
One caution the plot makes visible, and which bioMind flagged in the caption: TTN (13%) and MUC16 (12%) rank high largely because they are enormous genes. More coding sequence means more opportunity for passenger mutations. Ranking by raw frequency promotes them. Ranking by biology does not. Any frequency plot that presents TTN as a sarcoma driver is telling you about gene length, not selection.
In plain terms: TP53 makes the protein that halts a damaged cell before it divides. It is the cell's emergency brake, and it is broken in over a third of these tumors. Two other genes on the list are just very long, so they collect random typos by sheer size. Frequent does not mean important.
Step 3: The mutation landscape
Prompt: "Map the mutation landscape across all the tumors as an oncoprint."
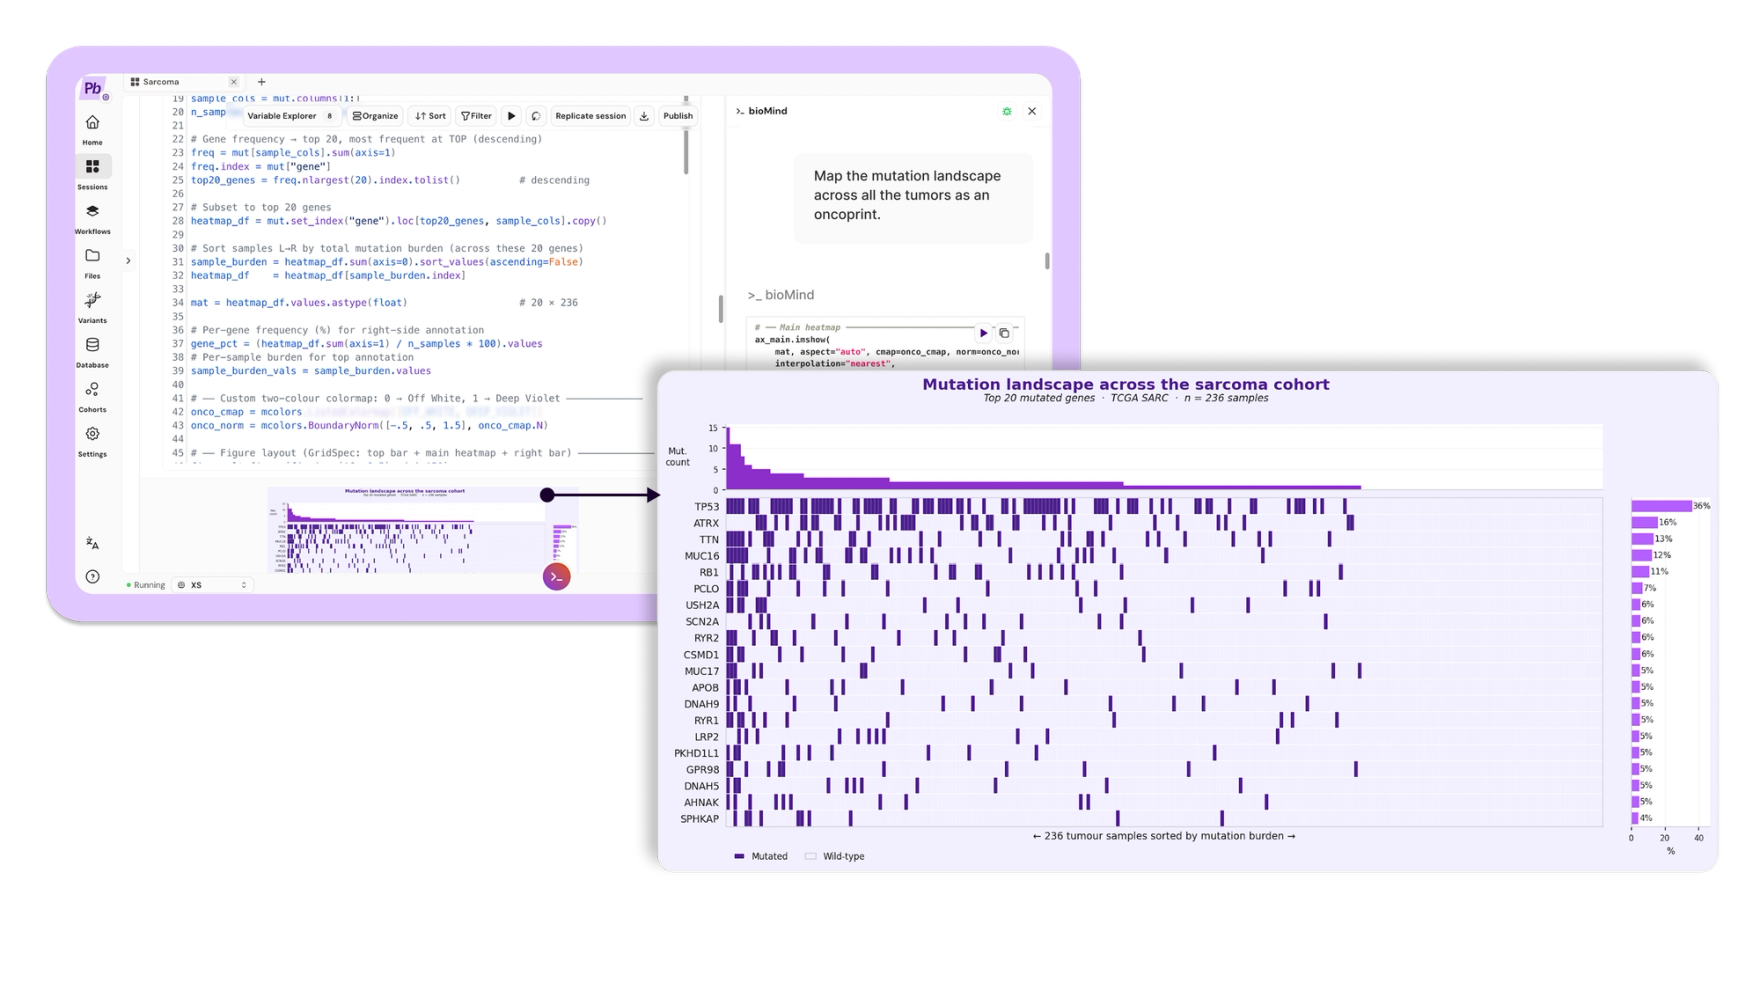
A ranked list tells you what recurs. It does not show you how those events distribute across patients. bioMind built a sample-level oncoprint of the top twenty mutated genes, ordered by mutation burden.
The picture is the analytical problem sarcoma poses, captured in one image: sparse, heterogeneous, and largely private. A handful of genes recur. Most tumors carry their own idiosyncratic set of events. There is no dominant, shared mutational program to target.
In plain terms: every column is one patient's tumor. Almost no two are alike. That is precisely why a single drug rarely works across sarcoma, and why these cancers are so hard.
Step 4: What the expression data does, and does not, tell you.
Prompt: "Show the expression signatures across the tumors as a clustered heatmap."
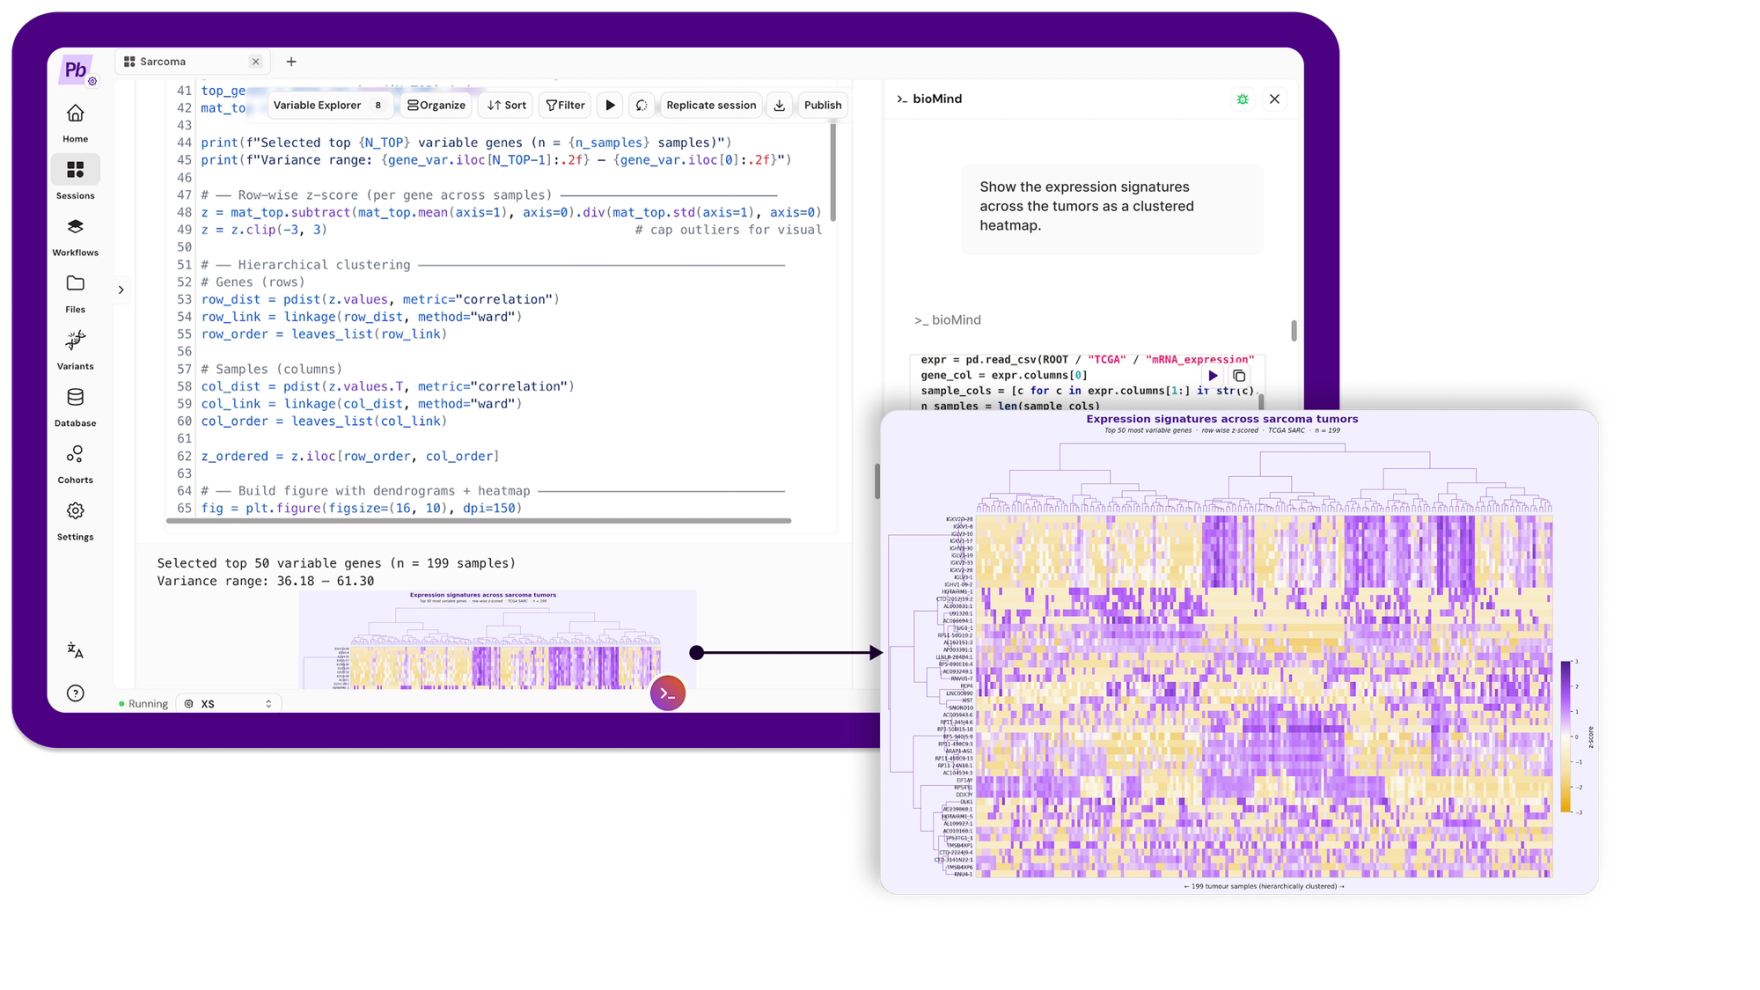
bioMind z-scored the top 50 most variable genes row-wise and clustered them with Ward linkage on correlation distance, across the 199 tumors with expression data.
Blocks of co-regulated genes appear, so there is real structure here. This is also where an honest analysis has to slow down, because the interesting question is not whether structure exists but what is producing it.
More importantly, look at which genes drive the variation. The top variable genes are dominated by two families: immunoglobulin genes (IGKV, IGLV, IGHV) and sex-chromosome genes (XIST, DDX3Y, RPS4Y1, EIF1AY). The first is an immune-infiltration axis, telling you about the tumor microenvironment. The second is patient sex. Neither is tumor subtype.
This cohort carries no histology labels, so we cannot claim the clustering recovers known subtypes. We can only report what the unsupervised structure actually reflects, which is partly biology of interest and partly biology we would want to regress out before making a subtype claim. Saying so is not a weakness of the analysis. It is the analysis.
In plain terms: the tumors do fall into groups, but some of what separates them is whether the patient was male or female, and how many immune cells were in the sample. That is not the same as tumor type. A tool that lets you see this is more useful than one that hands you three tidy clusters and lets you believe something untrue.
Step 5: A DNA change, read straight through to RNA
Prompt: "Do tumors with extra copies of MDM2 actually make more MDM2? Show it, with statistics."
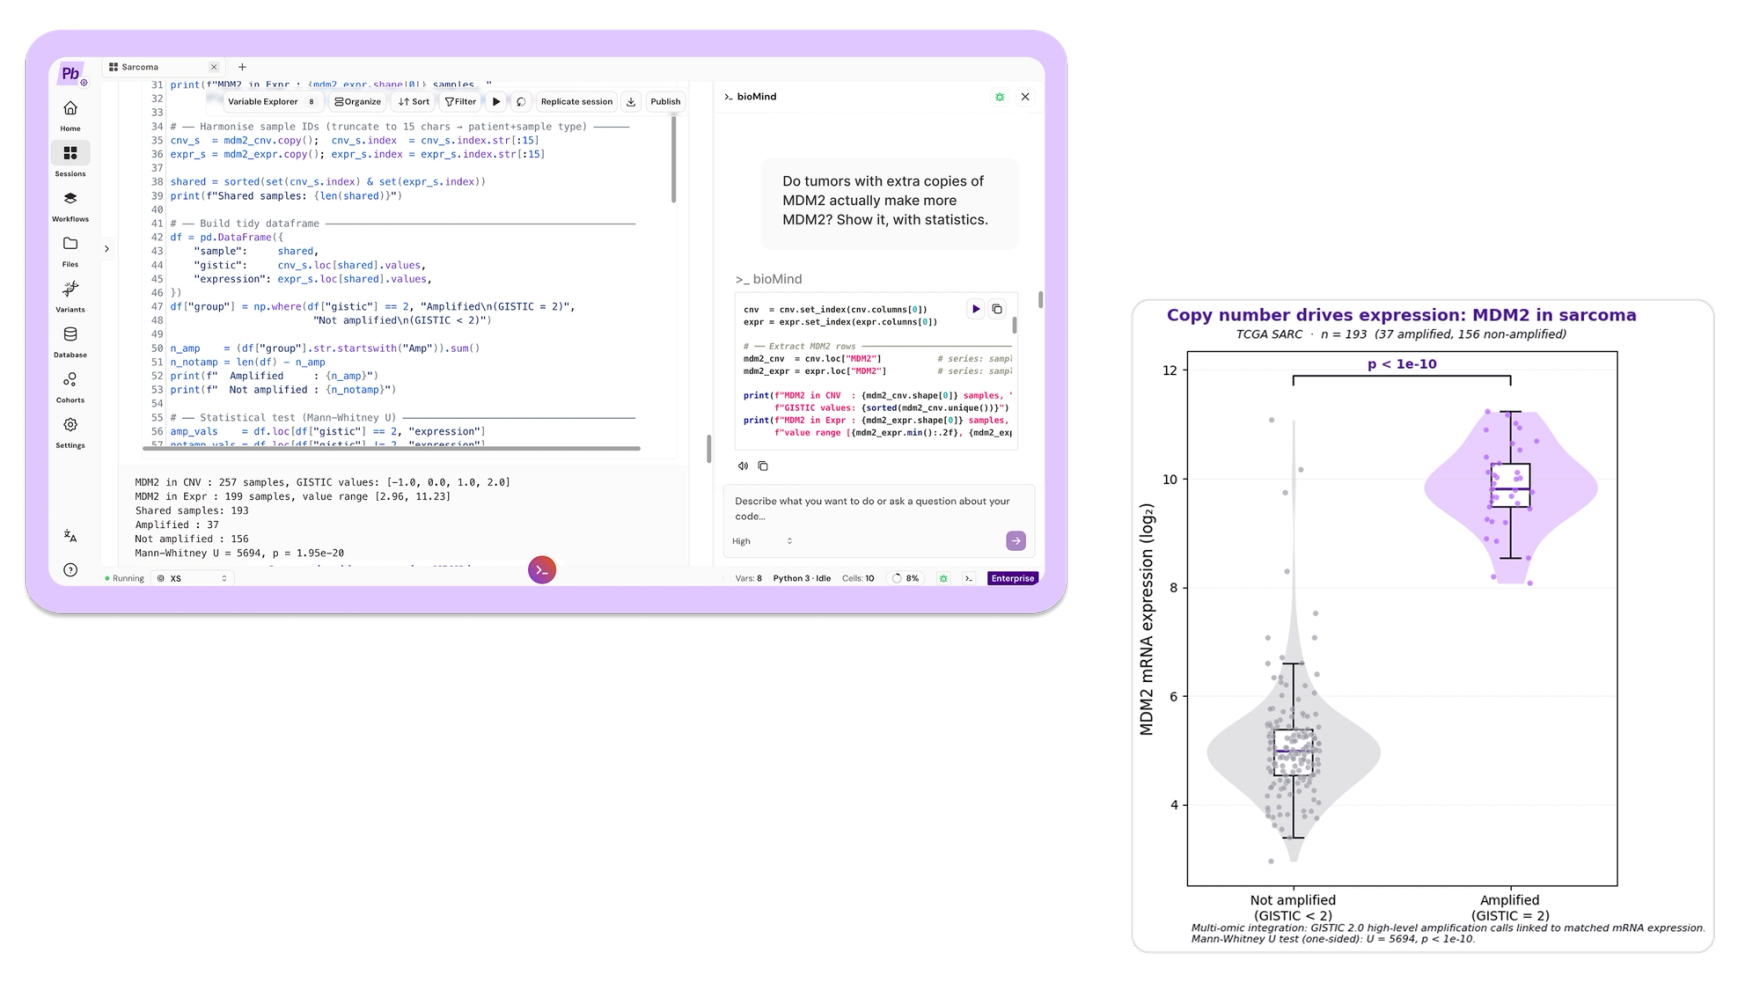
Now two layers meet. If a copy-number event is functional, it should show up in expression. bioMind split the 193 tumors with matched copy number and expression by MDM2 status using GISTIC 2.0 high-level amplification calls, compared expression across the groups, ran the test, and plotted it.
Tumors with MDM2 amplification (37 of 193) expressed MDM2 at roughly 28-fold the non-amplified level, a difference of about 4.8 log2 units (one-sided Mann-Whitney U, U = 5694, p = 1.95e-20).
That is a textbook cis-effect: the copy-number change is read directly through to the transcript. It also matters clinically. MDM2 sits on the 12q13-15 amplicon alongside CDK4 (amplified in 18%), and their co-amplification is the molecular signature of well-differentiated and dedifferentiated liposarcoma. Pathologists already use it to distinguish a malignant liposarcoma from a benign fatty lump. And MDM2 is a druggable node.
In plain terms: MDM2 is the off-switch for TP53's protein. When a tumor makes extra copies of the MDM2 gene, it floods the cell with off-switch, and the brake gets destroyed as fast as it is made. Here we watched the extra DNA copies turn into 28 times more of the message that builds that off-switch. Seeing DNA and RNA line up like this is how drug targets get found.
Step 6: Two routes, and almost never both
Here is where we stopped steering. The logic is simple enough to state in a sentence: if breaking TP53 and amplifying MDM2 both disable the same pathway, a tumor should not need to do both. So they should rarely co-occur. That prediction is well established in other cancer types. We had never tested it in this cohort, and we had both datasets sitting in the notebook.
Prompt: "Of the tumors with both mutation and copy number data, how many have a TP53 mutation, how many have MDM2 amplification, and how many have both? Test whether the two are mutually exclusive and show it as a simple contingency table."
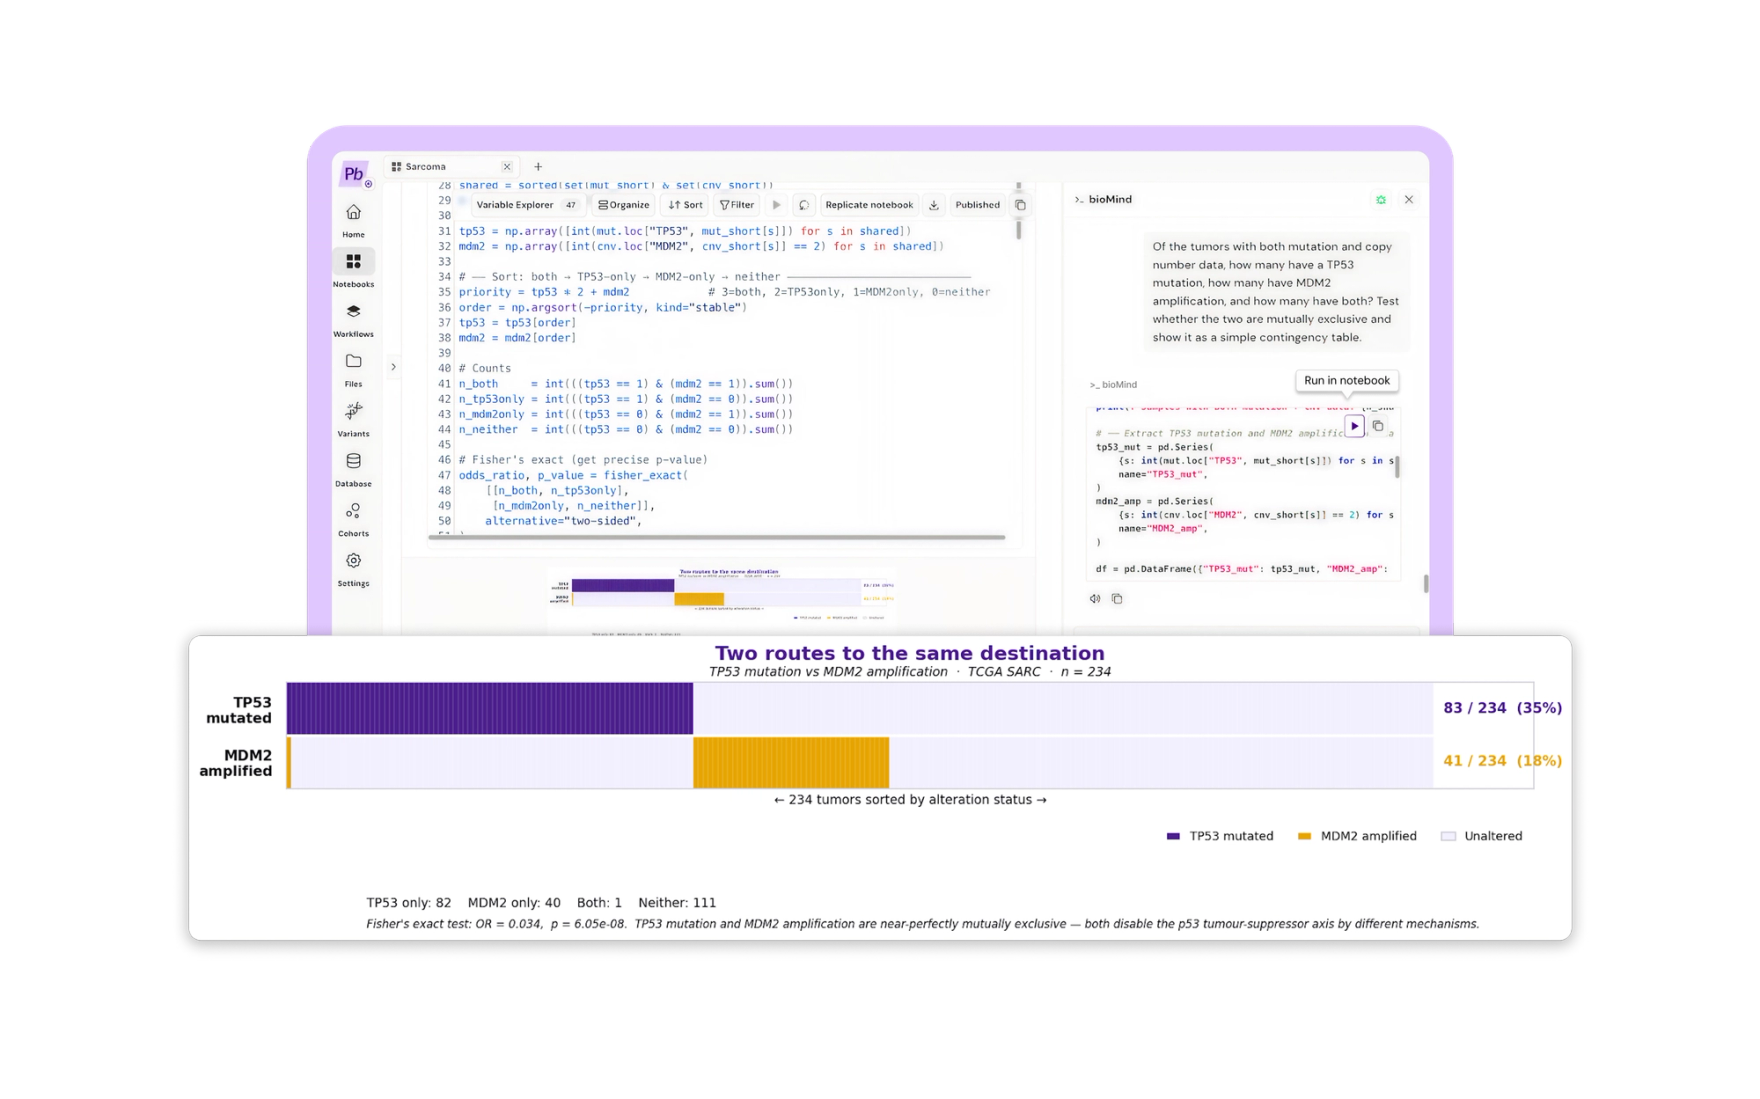
Across the 234 tumors with both layers: 82 carried a TP53 mutation only, 40 carried MDM2 amplification only, 111 carried neither, and exactly 1 carried both.
Under independence you would expect 14.5 tumors with both. We observed one. Fisher's exact test returns an odds ratio of 0.034 and p = 6.05e-08. A sarcoma with MDM2 amplification is roughly thirty times less likely to also carry a TP53 mutation than chance predicts.
This is not a discovery. It is a known principle of p53 biology, and any cancer geneticist reading this saw it coming. What is worth noticing is how it arrived. We did not encode the hypothesis, load a curated gene set, or run a bespoke pipeline. We asked a question in English, in a notebook, and a well-known law of tumor evolution reassembled itself out of two raw public matrices. Every cell was visible and reviewable before it ran.
That is the whole trust argument. When a platform independently recovers what you already know on data where you can check it, you have grounds to believe it on data where you cannot.
In plain terms: a tumor only needs to disable the brake once. Some sarcomas break the gene. Others drown it. Out of 234 tumors, exactly one bothered doing both. Scientists knew this already. The point is that nobody told the software, and it found it anyway.
Step 7: The cohort in one panel
Prompt: "Summarize the whole cohort in one headline panel."
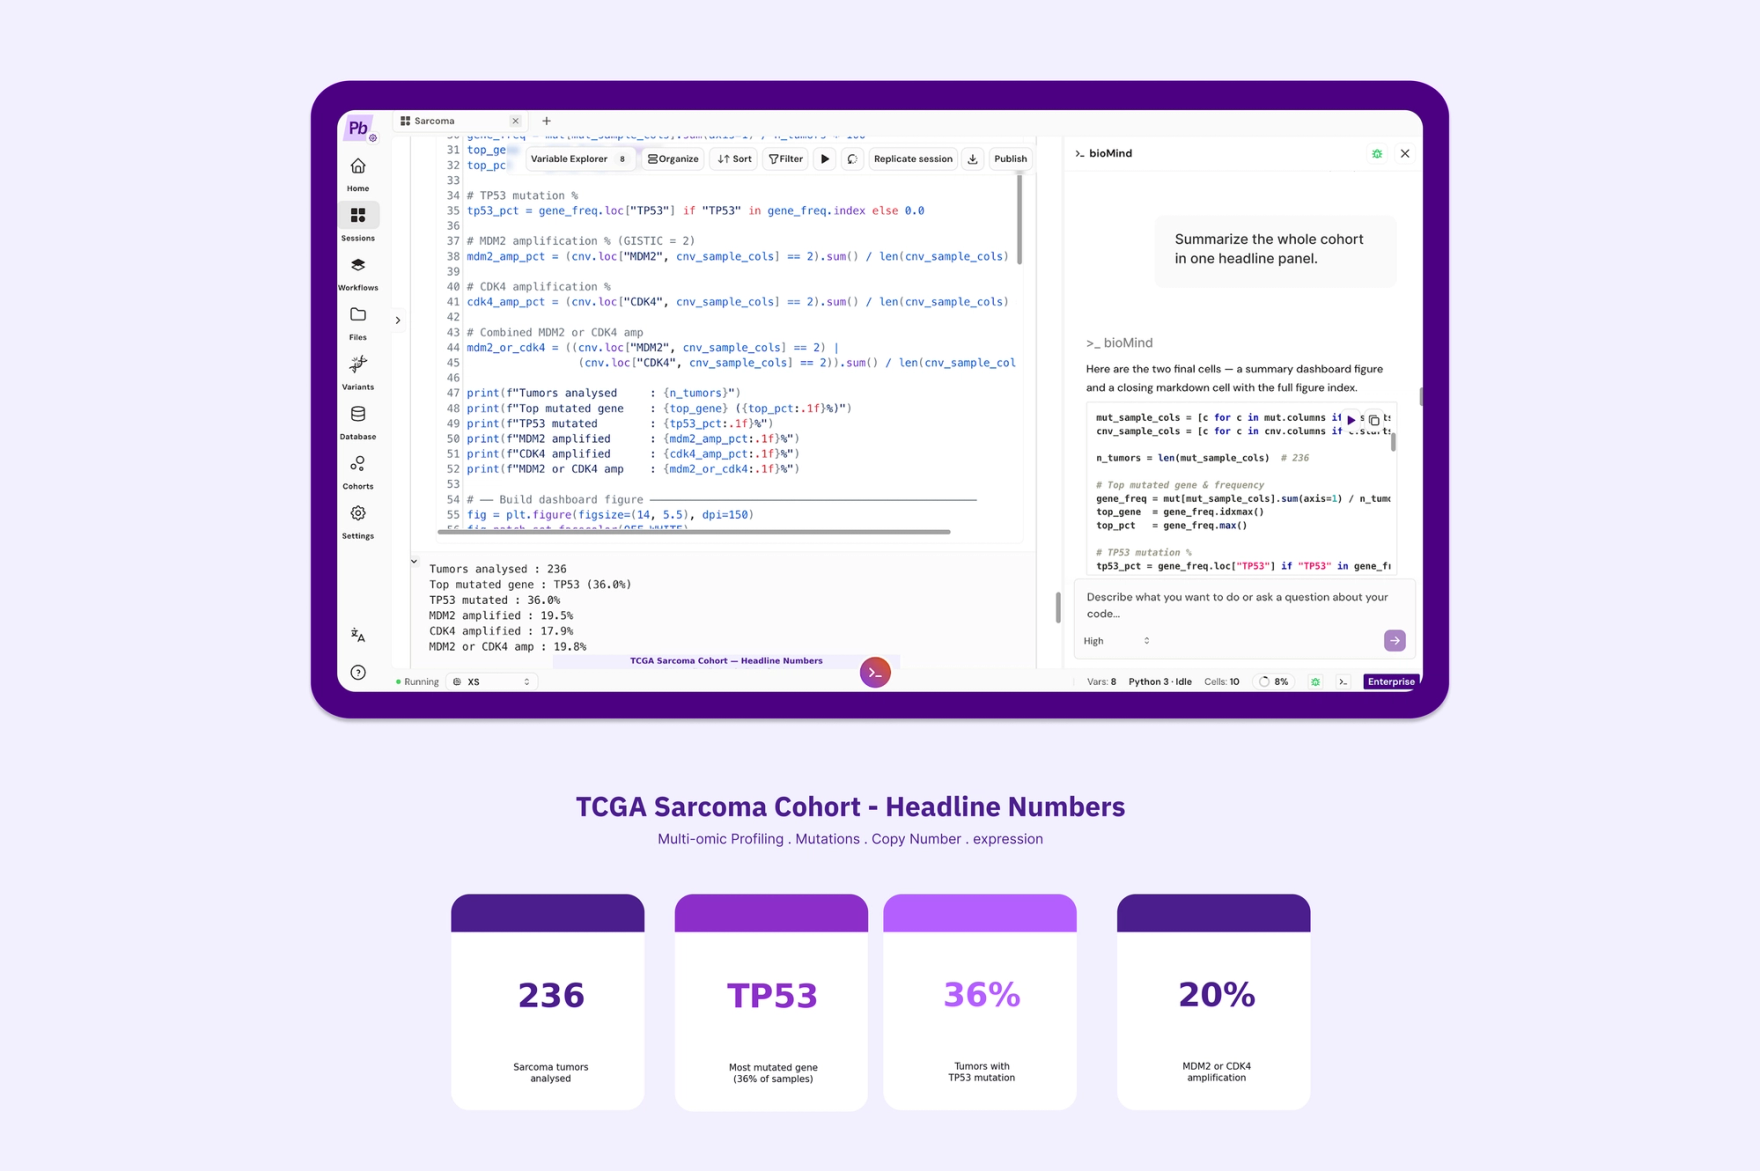
236 tumors. TP53 mutated in 36%. MDM2 or CDK4 amplified in roughly 20%. Every number traceable back to public TCGA-SARC data, and every figure produced by a cell we read before we ran it.
What actually happened here
What disappeared was not code, but the code tax: loading three matrices, reconciling sample identifiers across schemas, constructing the oncoprint, wiring up Fisher's exact test and the contingency table, and getting the figures publication-ready.
This also was not a smarter model doing science on its own. It was a frontier model situated inside a genomics notebook, with the right data and the right tools within reach. bioMind wrote and suggested. The researcher ran and decided. When the unsupervised clustering turned out to be partly driven by patient sex, no model flagged that as a problem. A human did, because a human was reading.
And when we asked a question whose answer was already in the literature, the data answered correctly. That is the result worth taking away.
If you have a cohort sitting in matrices you have not had time to stitch together, one session is all it takes. See what bioMind can run on your data.
Data source: TCGA-SARC, Genomic Data Commons, public. All figures generated in Pan.bio Notebooks with bioMind. Statistics: Mann-Whitney U (one-sided) for expression comparison; Fisher's exact test for mutual exclusivity. No patient-identifiable data was used.

Written by
Abdullah Al-Atia
Product at Pan.bio
Abdullah is a Product Manager with a strong business development focus at Pan.bio. He shapes the product roadmap in close collaboration with engineering and scientific teams, while building the partnerships and market presence that position Pan.bio at the forefront of accessible genomics and bioinformatics. With a background in pharmacy and driven by a passion for building products that make complex science usable, Abdullah is focused on advancing healthtech across the MENA region and beyond. Outside of work, Abdullah is a professional chess player and coach, with years spent deepening his own game and guiding students of all levels through theirs.
- BioAgents
How Are BioAgents Shaping the Future of Biomedical Applications and Clinical Decision Support?
introducing BioAgents, specialized agentic systems built on large language models (LLMs) that are designed to transform bioinformatics and clinical decision support.
- Bioinformatics
How will Large Language Models (LLMs) Transform Biomedical Research?
Large language models, such as GPT-3, have the potential to revolutionize biomedical research by helping scientists quickly and accurately analyze vast amounts of data.
- Bioinformatics
What Is bioMind? Claude, Built Into Your Genomics Notebook
bioMind is the AI copilot in Pan.bio's Notebooks: Claude, running in your notebook. It reads your files and writes the Python and R you run, from plots to PCA.